Resources
Plot templates for Microsoft Excel
Excel templates and instructions for some useful graph types can be found in the following OSF project .
- Dot diagram
template | instructions

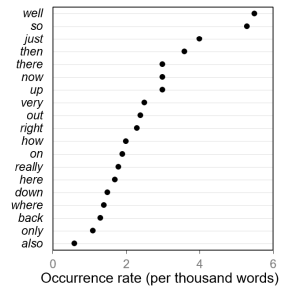
- Simple dot plot
template | instructions

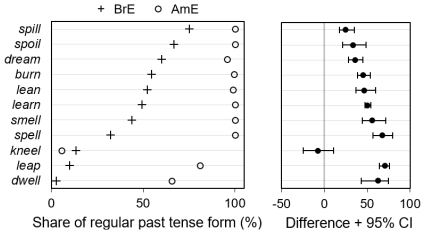
- Grouped dot plot
template | instructions

- Box plot
template | instructions

- Vertical dot plot
template

- Scatter plot
template | instructions

Speaker slides for workshop
- FJUEL workshop, Bamberg: speaker slides session 1 | speaker slides session 2 | speaker slides session 3