PhD workshop
Session 1: R project setup and Quarto documents
Create an RStudio project
- File : New project…
- New Directory
- New Project
- Use an informative directory name
- Store it where you will find it


RStudio project organization
- A project should be self-contained: All in one place
- Keep data files and analysis notebooks in your project folder
- Use subfolders: data, figures
Reproducibility
Your data analysis project should be self-contained, which means that everything that is needed to reproduce the results is stored in the project folder.

RStudio project setup
- Go to your project folder
- Create two subfolders: data, figures
Use analysis notebooks (Quarto documents)
- Quarto documents combine text, code, and output
- Can be exported as html/Word/PDF file
- In the analysis notebook:
- Talk to your (future) self: Say what you do (and why you do it)
- Run analyses
- Look at output (figures, tables,…)
![]()
Create a Quarto document
- File : New file : Quarto document…
- Use default options, click “Create”
- Save it in your project folder
- Render it: Click the Render button

![]()
Play around with the Quarto file
- Compare contents of file with rendered version
- Change/add text and render again
- Add headers / sub-headers
- Run code inside of RMarkdown file
- Add bold print
**bold** - Add italics
*italics* - Have a look at the RMarkdown Cheat Sheet

R: General advice
- Use the tidyverse set of packages
- Use ggplot2 for data visualization (Session 2)
- Workflow: Document every step using code
- Aim: Full reproducibility based on code + data
![]()
![]()
R package: dplyr
- Part of the
tidyverse - Piping
|>- Means “and then”
- Shortcut: Strg + Shift + M (Mac: Cmd + Shift + M)
![]()
R package ggplot2
- Part of the
tidyverse - “Grammar of Graphics”
![]()
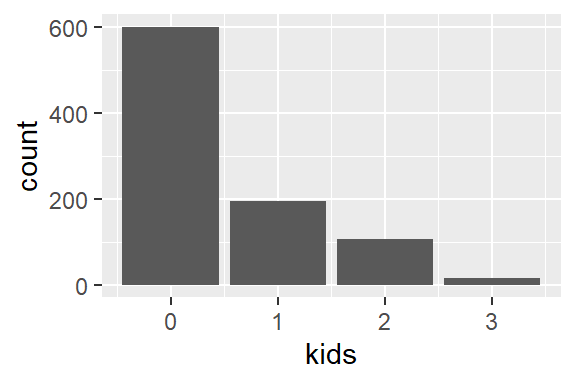
How many PhD students have (how many) kids?
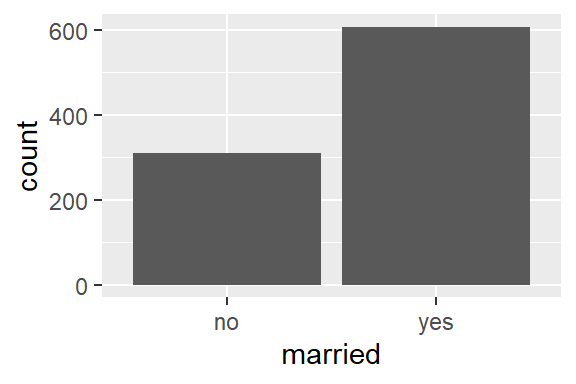
How many PhD students are married?
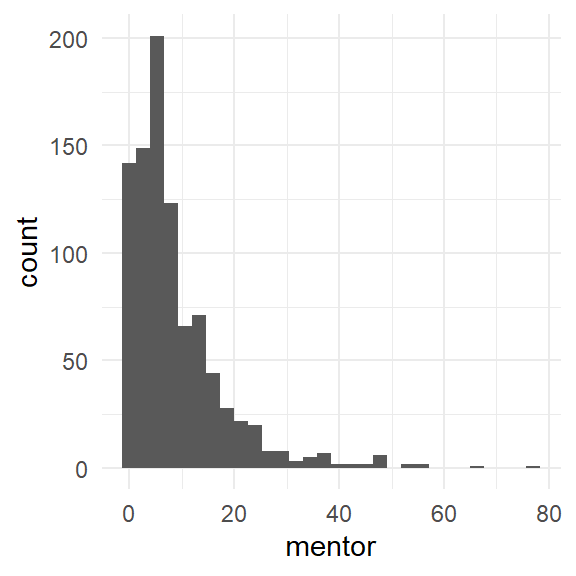
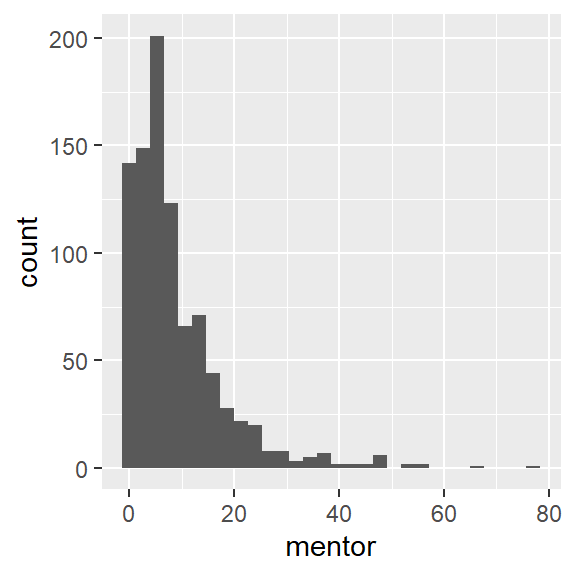
Distribution: Number of articles by mentor
Explore themes