Regression in R

Model specification and interpretation

Regression in R

  • Simplified version of the disagreement data
  • Outcome: Binary (direct vs. other)
  • Mixed-effects logistic regression

R packages

  • We need the following packages:
library(tidyverse)
library(here)
library(lme4)
library(arm)
library(marginaleffects)

Load data

d <- read.table(
    here("data",
         "data_disagreement.txt"),
    sep="\t",
    header=T,
    stringsAsFactors = T
    )

d$direct <- ifelse(d$strategy == "direct", 1, 0)

Fit mixed-effects model using glmer()

m <- glmer(
    direct ~ social_dist + involved + gender +
        (1|speaker) +
        (1|conv),
    family=binomial,
    data = d)

Table of coefficients: display()

display(m)
glmer(formula = direct ~ social_dist + involved + gender + (1 | 
    speaker) + (1 | conv), data = d, family = binomial)
                    coef.est coef.se
(Intercept)         -1.24     0.30  
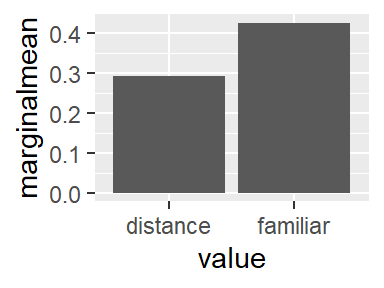
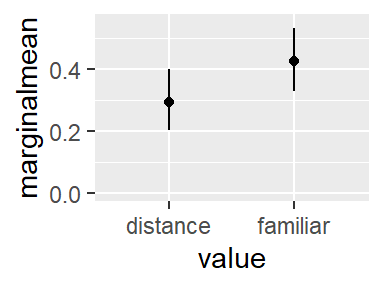
social_distfamiliar  0.59     0.32  
involvedyes          0.58     0.23  
genderm              0.12     0.26  

Error terms:
 Groups   Name        Std.Dev.
 speaker  (Intercept) 0.00    
 conv     (Intercept) 0.41    
 Residual             1.00    
---
number of obs: 353, groups: speaker, 44; conv, 22
AIC = 463.6, DIC = 418.8
deviance = 435.2 

Obtain marginal means: marginalmeans()

  • Argument to select specific predictors: variables=
marginalmeans(
    m, variables = "social_dist")
         term    value marginalmean conf.low conf.high p.value
1 social_dist distance         0.29     0.20      0.40    0.00
2 social_dist familiar         0.43     0.33      0.53    0.17

Graph marginal means + 95% CIs

marginalmeans(
    m, variables = "social_dist") |> 
    ggplot(aes(x=value, y=marginalmean)) +
    geom_col()

Graph marginal means + 95% CIs

marginalmeans(
    m, variables = "social_dist") |> 
    ggplot(aes(x=value, y=marginalmean)) +
    geom_point() + ylim(0,.55)+
    geom_linerange(aes(ymin=conf.low, ymax=conf.high))

Contrasts using comparisons()

comparisons(
  m,
  variables = "social_dist") |> 
    tidy() |> 
    dplyr::select(contrast, estimate, conf.low, conf.high)
             contrast estimate conf.low conf.high
1 familiar - distance     0.13    -0.01      0.26

Learn more